The client, Handmade in Harpenden, have multiple streams of revenue, varying from B2C and B2B, which made it difficult for the team to capture accurate sales in real time.

The Problem
1. Multiple revenue streams
Sales come from their website processed by Stripe, in store purchases which are processed by a Square POS (point of sale), marketplaces (such as Amazon and Not on the High Street) and Xero generated invoices for stockists, corporate and hospitality clients.
2. Multiple payment terms
This problem existed in two ways. Firstly each supplier they use to process payments have different fees and payout terms (daily and weekly) making it difficult to easily capture accurate sales during the working day. The second side of this problem is the client also juggles different payment terms for different kind of product offerings for clients making it difficult to create an accurate sales targets for the team to track against.
Before The Dashboard
In order to look at their current total they had to look at the mobile app for each payment processor they used and their recently paid invoices to mentally add up the totals. They were unable to use tools like Xero as Square and Stripe charge their fees before paying out and with their different payment terms it wasn’t translatable for sales target tracking.

Ideation
The clear solution for this is to create a dashboard which integrates with the source of each revenue stream, so that total sales can be seen immediately.
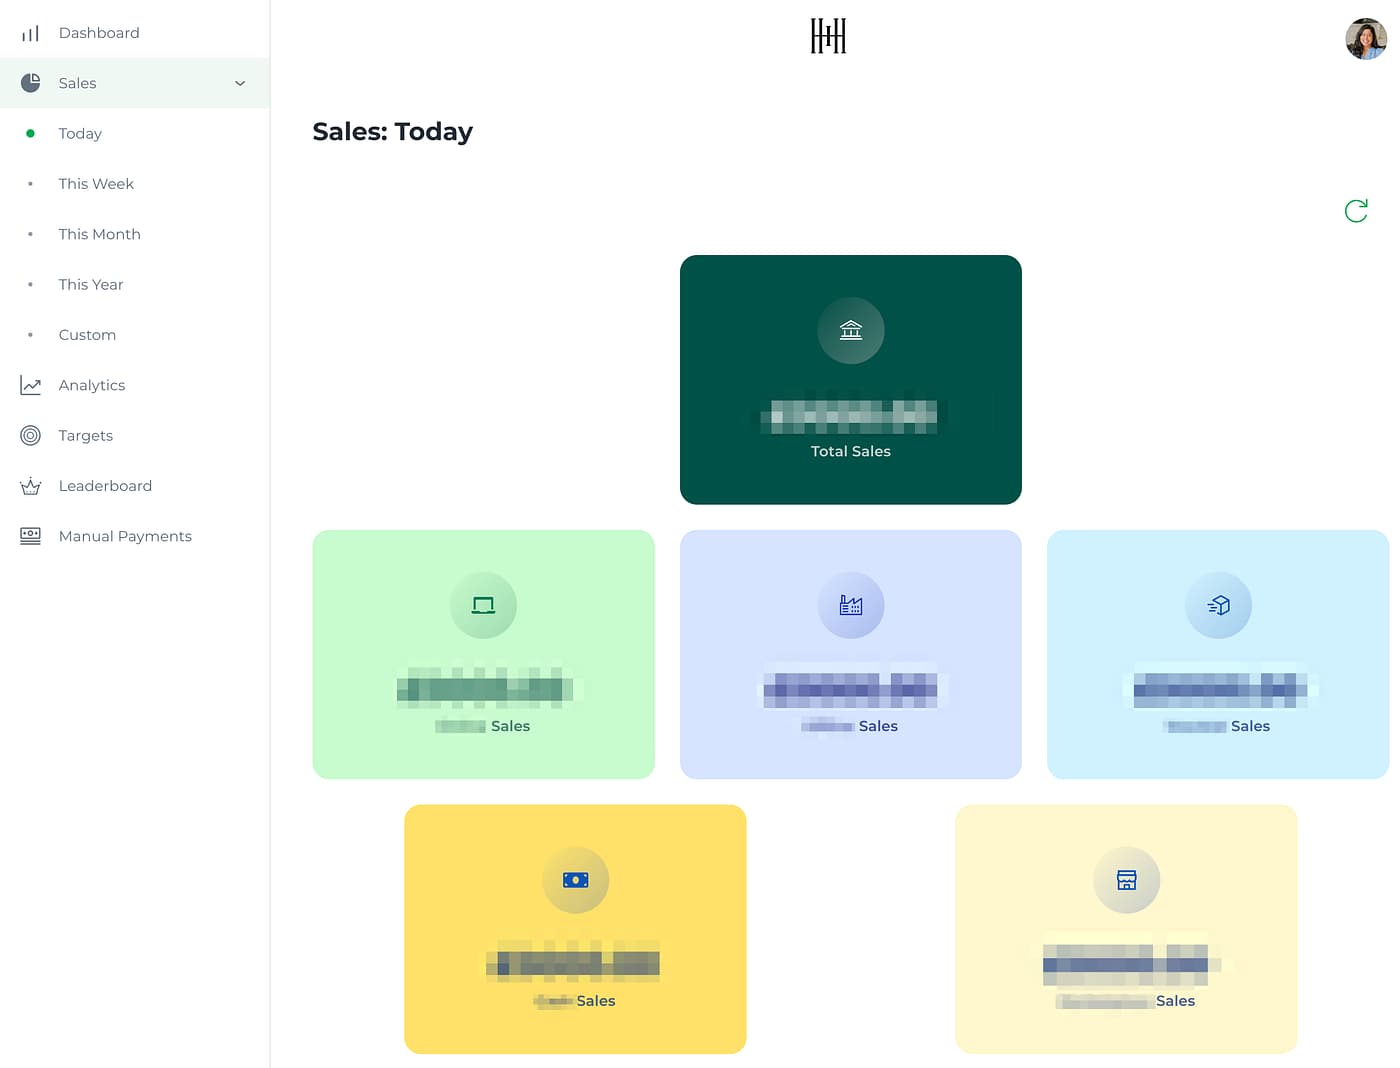
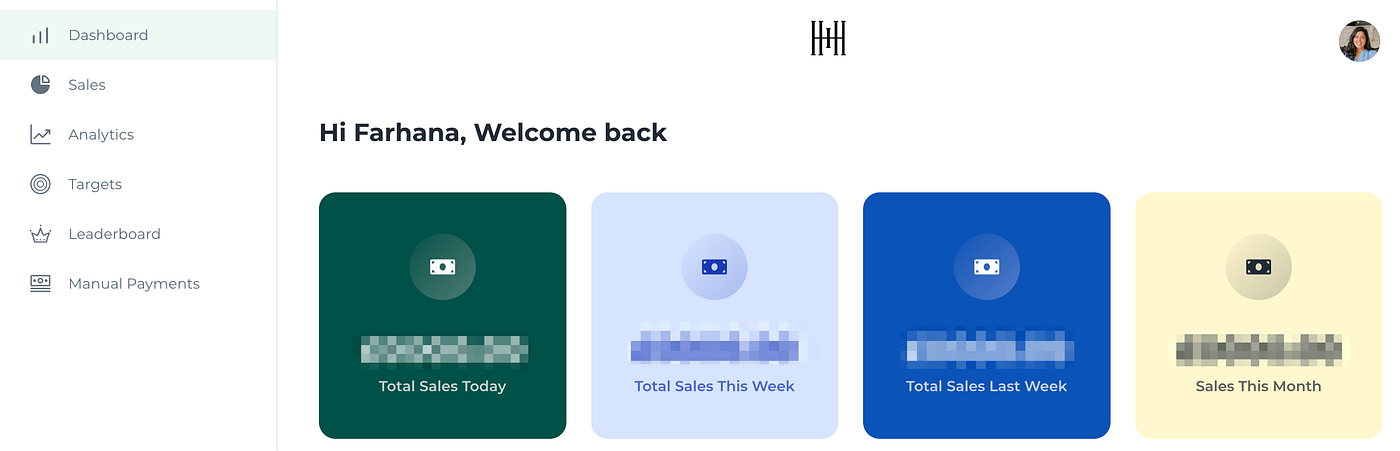
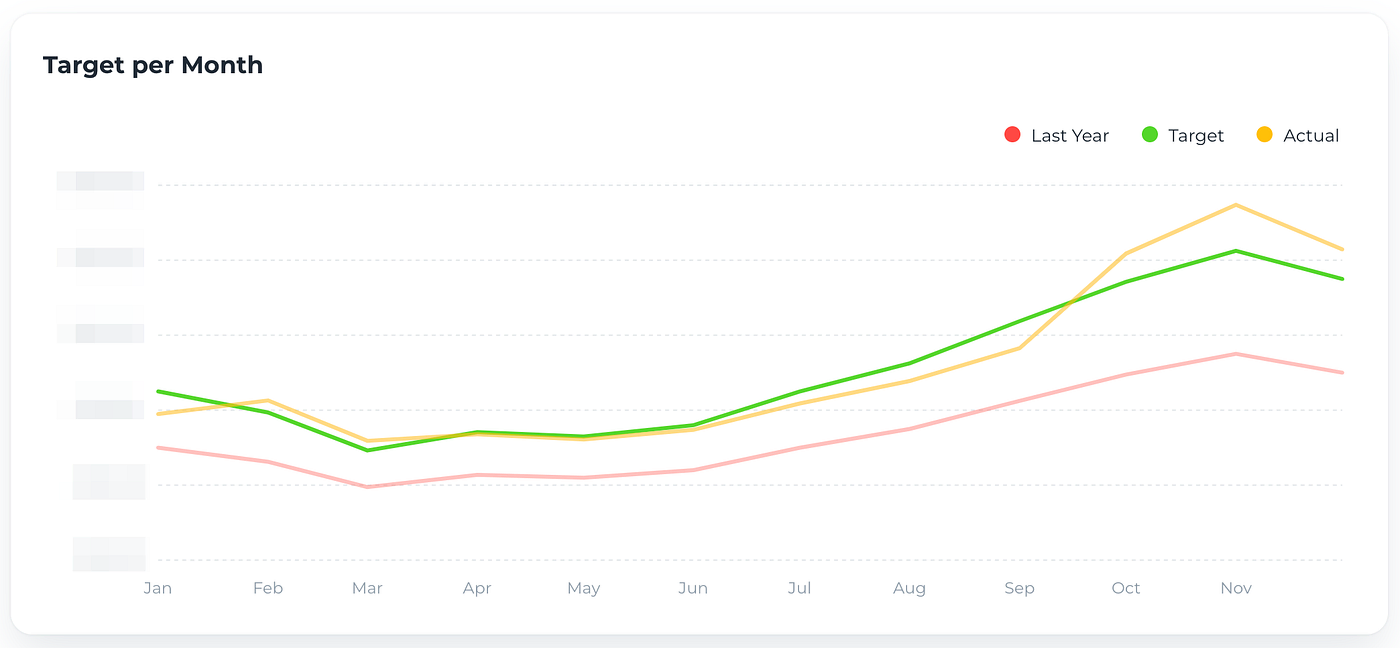
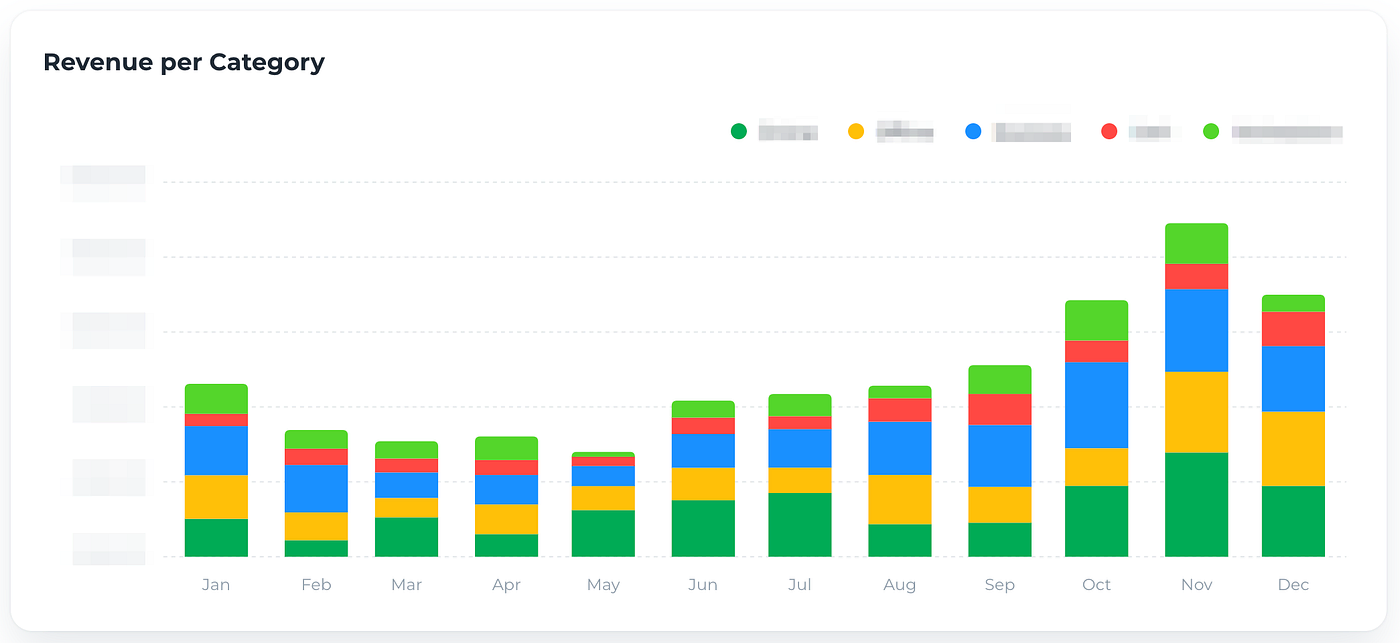
It was discovered up front that the most useful information to display on the dashboard was the total sales across all streams for the day, week and month; an area to see the breakdown of sales for that month from the different sources to compare them; then another area to track the totals compared to a target for that month.
The first time I loaded the dashboard it felt like my eyes were open for the very first time in how our business was doing that day. With no effort besides loading a page to capture so much just felt like all our frustration solved in seconds.
— Farhana, Founder
With an idea of what data we wanted to display in the dashboard, we also covered the costs of the dashboard and found a solution that fit in the budget. This is really important when building a custom team for a company as they need to feel reassured you can estimate the tool’s average spend per month.
I also looked at the best way to structure the sales data with the lowest overhead to fetch data to keep costs low. But we can look at this later.
Considerations
Each payment provider API I worked with stored data in a different format. This required converting into a common format in order to store and operate on each record. I was really lucky that every payment supplier the client uses had an API. All that was required was the client to give me secure access to work with.
In total I plugged APIs from Stripe, Square and Xero. I’ve found Stripe so far to be the easiest to work with. A second part of this project is plugging in the client’s bank data from Starling’s API. Once again, it’s extremely lucky the client bank with someone who has free access to a really well written API. Thanks Starling Bank!
The common format model started with a simple subset (such as date, amount and name) in order to fulfil the minimum requirements of the dashboard. This then evolved over time for the more complex use cases.
One challenge of this data was that an invoice for a stockist could be paid at any time (whereas online and in-person sales are immediate), this required having to check these invoices when looking at the totals in the dashboard to ensure the numbers are accurate.
Implementation
Managing Costs
Checking the like-for-like pricing across GCP (Google Cloud Platform), AWS (Amazon Web Services) and Microsoft Azure. It was GCP that offered the lowest cost for the use case and the best choice of infrastructure for the dashboard as it can host the frontend for the dashboard in Google App Engine and the backend functions that calculate the data can be done through Google Cloud Functions.
The Cloud Functions only run when required so you only pay for what you use, the trade-off being that there will be an initial wait time for them to start and warm up.
The Building Blocks
The functions are backed by the Firebase Firestore database, which offers a flat NoSQL structure. This makes it fairly simple to just store what information is useful to the dashboard and offers good flexibility in changing the schema at any point.
The backend code is written in NodeJS with Cloud Functions using TypeScript to take advantage of the type safety. The dashboard is written in JavaScript using Create React App with Material UI for styling and Redux for client-side caching.
The Challenge
The main challenge when building this dashboard was getting all the business rules correct for each stream of income. For instance, being sure that invoices are always up to date as they can be paid at any time and the date that the invoice was paid needs to be shown on the dashboard.
Lining up the times of sales between the mixture of monthly invoices and live feed meant taking careful design choices in ensuring that the sales were grouped into the correct month of when the money was paid into the business bank account.
Analysis
Cold stats on serverless functions
The most painful part of using serverless functions is the cold start time, when a function is first called the application has to be started in GCP and this can take around 10 seconds. There are mitigations for this, such as always having a function running even if it’s not being used, but there is a cost to always running functions.
Speed of JVM vs NodeJS serverless functions
Initially, the code was written in Kotlin and used the JVM-based variant of Google Cloud Functions. This was because there was some calculations that were processing a lot of numbers to calculate and it made sense to go with something that could handle more processing power than the single-threaded NodeJS option.
However, this became really painful when the cold-start time is compounded with the JVM warm up time. The combination of the two was at one point taking around 30 seconds for the first function to return data. This became too much of a cost and so I switched to using NodeJS.
Having had more time to look into this more recently, there are some interesting choices in this area with the option of using Google Cloud Run (Google’s next iteration of Cloud Functions) which supports the GraalVM. Therefore it could be as fast for the JVM to start up as NodeJS using a library such as Quarkus.
Conclusion
This project was out to solve the problem of viewing all sales data in one single place, without having to manually work anything out. In that respect, the project was a success with the client finding the dashboard solving the initial problem by having a single source of all sales data.
The Bonus
Working with the Square, Stripe, Xero and Starling APIs helped create an accurate snapshot of company sales. With this insight and real-time data access I was able to build a sales tracking page and analytics page against historic data to measure success. This was broken out on separate pages with toggle functionality for admins to apply. This is something I learned is really important for team morale. So once the sales pages were all set up and running I worked with the client to build analytics and targets pages to help the sales team see how well they were performing.
Personal Reflection
If I were to start the project over, I would stick with Google Cloud Platform as I think the combination of Firebase and Google App Engine were a delightfully simple way to get started, however I would branch out into seeing how the Cloud Run v2 Serverless functions work with GraalVM for better processing power in the JVM without the warm up time.